 |

A buffer solution is a solution whose pH does not change significantly on dilution or if a small amount of strong acid or base is added to it at constant temperature.[1] Buffer capacity is used to measure the resistance to pH change of a buffer solution.
Buffer solutions are used to maintain pH at a nearly constant value in a wide variety of chemical applications. In nature, many living systems use buffering to regulate pH. For example, the bicarbonate buffering system serves to regulate the pH of blood, and bicarbonate also acts as a buffer in the ocean.
Principles

Buffer solutions resist pH change because of a chemical equilibrium between the weak acid HA and its conjugate base A−:
When some strong acid is added to an equilibrium mixture of the weak acid and its conjugate base, hydrogen ions (H+) are added, and the equilibrium is shifted to the left, in accordance with Le Chatelier's principle. Because of this, the hydrogen ion concentration increases by less than the amount expected for the quantity of strong acid added. Similarly, if strong alkali is added to the mixture, the hydrogen ion concentration decreases by less than the amount expected for the quantity of alkali added. In Figure 1, the effect is illustrated by the simulated titration of a weak acid with pKa = 4.7. The relative concentration of undissociated acid is shown in blue, and that of its conjugate base in red. The pH changes relatively slowly in the buffer region, pH = pKa ± 1, centered at pH = 4.7, where [HA] = [A−]. The hydrogen ion concentration decreases by less than the amount expected because most of the added hydroxide ion is consumed in the reaction
and only a little is consumed in the neutralization reaction (which is the reaction that results in an increase in pH)
Once the acid is more than 95% deprotonated, the pH rises rapidly because most of the added alkali is consumed in the neutralization reaction.
Buffer capacity and buffer index
The buffer capacity () is a measure of the amount (number of moles or gram-equivalents, ) of a strong acid or base added to a given volume () of solution required to change its pH by a given amount ().


The buffer capacity () is highest when the addition of a large amount () of acid or base to the solution volume produces only a small pH change ().
Thus buffer capacity and the closely related buffer index are quantitative measures of a buffer solution's resistance to changes in pH in response to changes in acid or alkali concentration. Buffer capacity and buffer index are quasi-synonyms (both are denoted ), but their definitions differ slightly in the extent of pH change they consider.
The concept of buffer capacity, how to determine it from acid-base titration measurements, and its mathematical significance in relation to the dissociation constant () of the buffer solution and its behaviour in response to an external perturbation were introduced by the Dutch-American biochemist Donald Dexter Van Slyke in 1922.[2]

The buffer index (also ) considers an infinitesimal change in pH (for mathematical calculation purposes), whereas the buffer capacity considers a macroscopic pH change of 1 pH unit (for titration measurements).
Thus

When taking also into account the volume () of the titrated buffer solution, its buffer capacity () can be defined in term of concentration changes:[3][4][5]

Where:
- V: the volume of the buffer solution (1 L)
- Δn: the quantity (in mol) of added strong acid or base
- ΔpH: the absolute value of the difference in pH (before and after addition)
When considering an infinitesimal variation in concentration and an infinitesimal change in pH, ), the buffer capacity can be expressed as a buffer index ():


where is an infinitesimal change in base concentration in the buffer solution due to the amount of base added, or

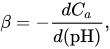
where is an infinitesimal change in acid concentration in the buffer solution due to the amount of acid added.

pH is defined as −log10[H+], and d(pH) is an infinitesimal change in pH.
With either definition, the buffer capacity for a weak acid HA with dissociation constant Ka can be expressed as[6][7][4] where [H+] is the concentration of hydrogen ions, and is the total concentration of added acid. Kw is the equilibrium constant for self-ionization of water, equal to 1.0×10⁻¹⁴. Note that in solution H+ exists as the hydronium ion H3O+, and further aquation of the hydronium ion has negligible effect on the dissociation equilibrium, except at very high acid concentration.
![{\displaystyle \beta =2.303\left([{\mathrm {H} {\vphantom {A}}^{+}}]+{\frac {T_{\mathrm {HA} }K_{a}[{\mathrm {H} {\vphantom {A}}^{+}}]}{(K_{a}+[{\mathrm {H} {\vphantom {A}}^{+}}])^{2}}}+{\frac {K_{\text{w}}}{[{\mathrm {H} {\vphantom {A}}^{+}}]}}\right),}](https://wikimedia.org/api/rest_v1/media/math/render/svg/bf8b7c2c34d12f8145df3299a061593aaa76643a)


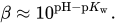
This equation shows that there are three regions of raised buffer capacity (see figure 2).
- In the central region of the curve (colored green on the plot), the second term is dominant, and Buffer capacity rises to a local maximum at pH = pKa. The height of this peak depends on the value of pKa. Buffer capacity is negligible when the concentration [HA] of buffering agent is very small and increases with increasing concentration of the buffering agent.[4] Some authors show only this region in graphs of buffer capacity.[3] Buffer capacity falls to 33% of the maximum value at pH = pKa ± 1, to 10% at pH = pKa ± 1.5 and to 1% at pH = pKa ± 2. For this reason, the most useful range is approximately pKa ± 1. When choosing a buffer for use at a specific pH, it should have a pKa value as close as possible to that pH.[3]
- With strongly acidic solutions, pH less than about 2 (coloured red on the plot), the first term in the equation dominates, and buffer capacity rises exponentially with decreasing pH: This results from the fact that the second and third terms become negligible at very low pH. This term is independent of the presence or absence of a buffering agent.
- With strongly alkaline solutions, pH more than about 12 (coloured blue on the plot), the third term in the equation dominates, and buffer capacity rises exponentially with increasing pH: This results from the fact that the first and second terms become negligible at very high pH. This term is also independent of the presence or absence of a buffering agent.
![{\displaystyle \beta \approx 2.303{\frac {T_{\mathrm {HA} }K_{a}[{\mathrm {H} {\vphantom {A}}^{+}}]}{(K_{a}+[{\mathrm {H} {\vphantom {A}}^{+}}])^{2}}}.}](https://wikimedia.org/api/rest_v1/media/math/render/svg/ec0e3ba9d065bfb822350b58e375d1f4630c6235)

Calculating buffer pH
Monoprotic acids
First write down the equilibrium expression
This shows that when the acid dissociates, equal amounts of hydrogen ion and anion are produced. The equilibrium concentrations of these three components can be calculated in an ICE table (ICE standing for "initial, change, equilibrium").
ICE table for a monoprotic acid [HA] [A−] [H+] I C0 0 y C −x x x E C0 − x x x + y
The first row, labelled I, lists the initial conditions: the concentration of acid is C0, initially undissociated, so the concentrations of A− and H+ would be zero; y is the initial concentration of added strong acid, such as hydrochloric acid. If strong alkali, such as sodium hydroxide, is added, then y will have a negative sign because alkali removes hydrogen ions from the solution. The second row, labelled C for "change", specifies the changes that occur when the acid dissociates. The acid concentration decreases by an amount −x, and the concentrations of A− and H+ both increase by an amount +x. This follows from the equilibrium expression. The third row, labelled E for "equilibrium", adds together the first two rows and shows the concentrations at equilibrium.
To find x, use the formula for the equilibrium constant in terms of concentrations:
![{\displaystyle K_{\text{a}}={\frac {[{\mathrm {H} {\vphantom {A}}^{+}}][{\mathrm {A} {\vphantom {A}}^{-}}]}{[{\mathrm {HA} }]}}.}](https://wikimedia.org/api/rest_v1/media/math/render/svg/89cb17f8ab679cc14a5d23888ed230c1a71b7384)
Substitute the concentrations with the values found in the last row of the ICE table:
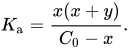
Simplify to

With specific values for C0, Ka and y, this equation can be solved for x. Assuming that pH = −log10[H+], the pH can be calculated as pH = −log10(x + y).
Polyprotic acids

Polyprotic acids are acids that can lose more than one proton. The constant for dissociation of the first proton may be denoted as Ka1, and the constants for dissociation of successive protons as Ka2, etc. Citric acid is an example of a polyprotic acid H3A, as it can lose three protons.
Stepwise dissociation constants Equilibrium Citric acid H3A ⇌ H2A− + H+ pKa1 = 3.13 H2A− ⇌ HA2− + H+ pKa2 = 4.76 HA2− ⇌ A3− + H+ pKa3 = 6.40
When the difference between successive pKa values is less than about 3, there is overlap between the pH range of existence of the species in equilibrium. The smaller the difference, the more the overlap. In the case of citric acid, the overlap is extensive and solutions of citric acid are buffered over the whole range of pH 2.5 to 7.5.
Calculation of the pH with a polyprotic acid requires a speciation calculation to be performed. In the case of citric acid, this entails the solution of the two equations of mass balance:
![{\displaystyle {\begin{aligned}C_{\mathrm {A} }&=[{\mathrm {A} {\vphantom {A}}^{3-}}]+\beta _{1}[{\mathrm {A} {\vphantom {A}}^{3-}}][{\mathrm {H} {\vphantom {A}}^{+}}]+\beta _{2}[{\mathrm {A} {\vphantom {A}}^{3-}}][{\mathrm {H} {\vphantom {A}}^{+}}]^{2}+\beta _{3}[{\mathrm {A} {\vphantom {A}}^{3-}}][{\mathrm {H} {\vphantom {A}}^{+}}]^{3},\\C_{\mathrm {H} }&=[{\mathrm {H} {\vphantom {A}}^{+}}]+\beta _{1}[{\mathrm {A} {\vphantom {A}}^{3-}}][{\mathrm {H} {\vphantom {A}}^{+}}]+2\beta _{2}[{\mathrm {A} {\vphantom {A}}^{3-}}][{\mathrm {H} {\vphantom {A}}^{+}}]^{2}+3\beta _{3}[{\mathrm {A} {\vphantom {A}}^{3-}}][{\mathrm {H} {\vphantom {A}}^{+}}]^{3}-K_{\text{w}}[{\mathrm {H} {\vphantom {A}}^{+}}]^{-1}.\end{aligned}}}](https://wikimedia.org/api/rest_v1/media/math/render/svg/611bf20542dfc1dbd8256ee6465883f1534f527a)
CA is the analytical concentration of the acid, CH is the analytical concentration of added hydrogen ions, βq are the cumulative association constants. Kw is the constant for self-ionization of water. There are two non-linear simultaneous equations in two unknown quantities [A3−] and [H+]. Many computer programs are available to do this calculation. The speciation diagram for citric acid was produced with the program HySS.[8]
N.B. The numbering of cumulative, overall constants is the reverse of the numbering of the stepwise, dissociation constants.
Relationship between cumulative association constant (β) values and stepwise dissociation constant (K) values for a tribasic acid. Equilibrium Relationship A3− + H+ ⇌ AH2+ Log β1= pka3 A3− + 2H+ ⇌ AH2+ Log β2 =pka2 + pka3 A3− + 3H+⇌ AH3 Log β3 = pka1 + pka2 + pka3
Cumulative association constants are used in general-purpose computer programs such as the one used to obtain the speciation diagram above.
Applications
The pH of a solution containing a buffering agent can only vary within a narrow range, regardless of what else may be present in the solution. In biological systems this is an essential condition for enzymes to function correctly. For example, in human blood a mixture of carbonic acid (H
2CO
3) and bicarbonate (HCO−
3) is present in the plasma fraction; this constitutes the major mechanism for maintaining the pH of blood between 7.35 and 7.45. Outside this narrow range (7.40 ± 0.05 pH unit), acidosis and alkalosis metabolic conditions rapidly develop, ultimately leading to death if the correct buffering capacity is not rapidly restored.
If the pH value of a solution rises or falls too much, the effectiveness of an enzyme decreases in a process, known as denaturation, which is usually irreversible.[9] The majority of biological samples that are used in research are kept in a buffer solution, often phosphate buffered saline (PBS) at pH 7.4.
In industry, buffering agents are used in fermentation processes and in setting the correct conditions for dyes used in colouring fabrics. They are also used in chemical analysis[7] and calibration of pH meters.
Simple buffering agents
Buffering agent pKa Useful pH range Citric acid 3.13, 4.76, 6.40 2.1–7.4 Acetic acid 4.7 3.8–5.8 KH2PO4 7.2 6.2–8.2 CHES 9.3 8.3–10.3 Borate 9.24 8.25–10.25
For buffers in acid regions, the pH may be adjusted to a desired value by adding a strong acid such as hydrochloric acid to the particular buffering agent. For alkaline buffers, a strong base such as sodium hydroxide may be added. Alternatively, a buffer mixture can be made from a mixture of an acid and its conjugate base. For example, an acetate buffer can be made from a mixture of acetic acid and sodium acetate. Similarly, an alkaline buffer can be made from a mixture of the base and its conjugate acid.
"Universal" buffer mixtures
By combining substances with pKa values differing by only two or less and adjusting the pH, a wide range of buffers can be obtained. Citric acid is a useful component of a buffer mixture because it has three pKa values, separated by less than two. The buffer range can be extended by adding other buffering agents. The following mixtures (McIlvaine's buffer solutions) have a buffer range of pH 3 to 8.[10]
0.2 M Na2HPO4 (mL) 0.1 M citric acid (mL) pH 20.55 79.45 3.0 38.55 61.45 4.0 51.50 48.50 5.0 63.15 36.85 6.0 82.35 17.65 7.0 97.25 2.75 8.0
A mixture containing citric acid, monopotassium phosphate, boric acid, and diethyl barbituric acid can be made to cover the pH range 2.6 to 12.[11]
Other universal buffers are the Carmody buffer[12] and the Britton–Robinson buffer, developed in 1931.
Common buffer compounds used in biology
For effective range see Buffer capacity, above. Also see Good's buffers for the historic design principles and favourable properties of these buffer substances in biochemical applications.
| Common name (chemical name) | Structure | pKa, 25 °C |
Temp. effect, dpH/dT (K−1)[13] |
Mol. weight |
|---|---|---|---|---|
| TAPS, ([tris(hydroxymethyl)methylamino]propanesulfonic acid) |
 |
8.43 | −0.018 | 243.3 |
| Bicine, (2-(bis(2-hydroxyethyl)amino)acetic acid) |
 |
8.35 | −0.018 | 163.2 |
| Tris, (tris(hydroxymethyl)aminomethane, or 2-amino-2-(hydroxymethyl)propane-1,3-diol) |
 |
8.07[a] | −0.028 | 121.14 |
| Tricine, (N-[tris(hydroxymethyl)methyl]glycine) |
 |
8.05 | −0.021 | 179.2 |
| TAPSO, (3-[N-tris(hydroxymethyl)methylamino]-2-hydroxypropanesulfonic acid) |
 |
7.635 | 259.3 | |
| HEPES, (4-(2-hydroxyethyl)-1-piperazineethanesulfonic acid) |
 |
7.48 | −0.014 | 238.3 |
| TES, (2-[[1,3-dihydroxy-2-(hydroxymethyl)propan-2-yl]amino]ethanesulfonic acid) |
 |
7.40 | −0.020 | 229.20 |
| MOPS, (3-(N-morpholino)propanesulfonic acid) |
 |
7.20 | −0.015 | 209.3 |
| PIPES, (piperazine-N,N′-bis(2-ethanesulfonic acid)) |
 |
6.76 | −0.008 | 302.4 |
| Cacodylate, (dimethylarsenic acid) |
 |
6.27 | 138.0 | |
| MES, (2-(N-morpholino)ethanesulfonic acid) |
 |
6.15 | −0.011 | 195.2 |
See also
- Henderson–Hasselbalch equation
- Good's buffers
- Common-ion effect
- Metal ion buffer
- Mineral redox buffer
- TSE buffer
Notes
- ^ Tris is a base, the pKa = 8.07 refers to its conjugate acid.
References
- ^ J. Gordon Betts (25 April 2013). "Inorganic compounds essential to human functioning". Anatomy and Physiology. OpenStax. ISBN 978-1-947172-04-3. Retrieved 14 May 2023.
- ^ Van Slyke, Donald D. (1922). "On the measurement of buffer values and on the relationship of buffer value to the dissociation constant of the buffer and the concentration and reaction of the buffer solution". Journal of Biological Chemistry. 52 (2): 525–570. doi:10.1016/S0021-9258(18)85845-8. Retrieved 2026-10-04.
- ^ a b c Skoog, Douglas A.; West, Donald M.; Holler, F. James; Crouch, Stanley R. (2014). Fundamentals of Analytical Chemistry (9th ed.). Brooks/Cole. p. 226. ISBN 978-0-495-55828-6.
- ^ a b c Urbansky, Edward T.; Schock, Michael R. (2000). "Understanding, Deriving and Computing Buffer Capacity". Journal of Chemical Education. 77 (12): 1640–1644. Bibcode:2000JChEd..77.1640U. doi:10.1021/ed077p1640.
- ^ Chiriac, Veronica; Balea, Gabriel (1997). "Buffer Index and Buffer Capacity for a Simple Buffer Solution". Journal of Chemical Education. 74 (8): 937. doi:10.1021/ed074p937. ISSN 0021-9584. Retrieved 2026-10-04.
- ^ Butler, J. N. (1998). Ionic Equilibrium: Solubility and pH calculations. Wiley. pp. 133–136. ISBN 978-0-471-58526-8.
- ^ a b Hulanicki, A. (1987). Reactions of acids and bases in analytical chemistry. Translated by Masson, Mary R. Horwood. ISBN 978-0-85312-330-9.
- ^ Alderighi, L.; Gans, P.; Ienco, A.; Peters, D.; Sabatini, A.; Vacca, A. (1999). "Hyperquad simulation and speciation (HySS): a utility program for the investigation of equilibria involving soluble and partially soluble species". Coordination Chemistry Reviews. 184 (1): 311–318. doi:10.1016/S0010-8545(98)00260-4. Archived from the original on 2007-07-04.
- ^ Scorpio, R. (2000). Fundamentals of Acids, Bases, Buffers & Their Application to Biochemical Systems. Kendall/Hunt Publishing Company. ISBN 978-0-7872-7374-3.
- ^ McIlvaine, T. C. (1921). "A buffer solution for colorimetric comparaison" (PDF). J. Biol. Chem. 49 (1): 183–186. doi:10.1016/S0021-9258(18)86000-8. Archived (PDF) from the original on 2015-02-26.
- ^ Mendham, J.; Denny, R. C.; Barnes, J. D.; Thomas, M. (2000). "Appendix 5". Vogel's textbook of quantitative chemical analysis (5th ed.). Harlow: Pearson Education. ISBN 978-0-582-22628-9.
- ^ Carmody, Walter R. (1961). "Easily prepared wide range buffer series". J. Chem. Educ. 38 (11): 559–560. Bibcode:1961JChEd..38..559C. doi:10.1021/ed038p559.
- ^ "Buffer Reference Center". Sigma-Aldrich. Archived from the original on 2009-04-17. Retrieved 2009-04-17.
External links
"Biological buffers". REACH Devices.